TSViz - A Time Series
Visualization Framework
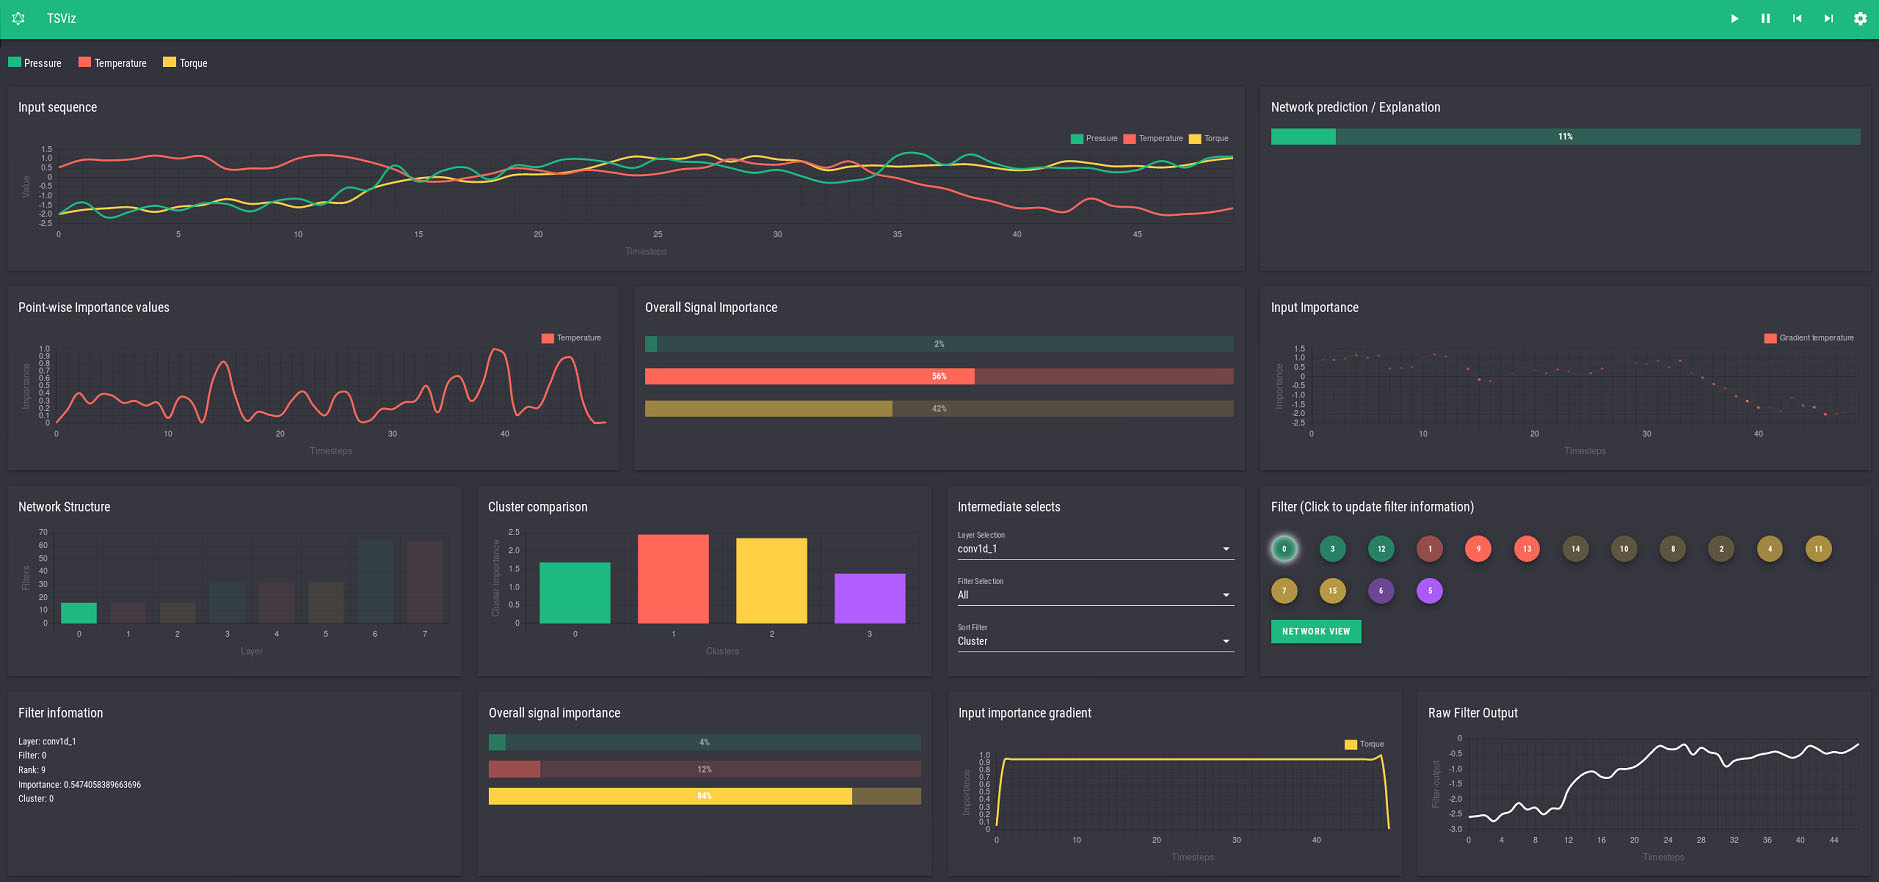
Understand the network’s behavior on global or local levels and analyze the impact of different parts of the model. Coarse to fine-grained information is presented to understand and optimize the network.
- Input Importance - How relevant was each data point?
- Filter Importance - Which network parts were relevant?
- Network Cluster - Which parts are redundant?
Features
Using the framework requires only the data and a suitable deep learning model. The RESTful API computes the influences and provides the possibility to save the results for detailed data analysis or visualization. Using the RESTful API in conjunction with the dashboard enables the user to visualizes the data and provides optimization utilities. One important design aspect is that our dashboard can be divided into different section covering the different level of user experience. Furthermore, the dashboard can be used in an offline mode using your selected data suited for presentation of goal directed inspection.
Data Analysis
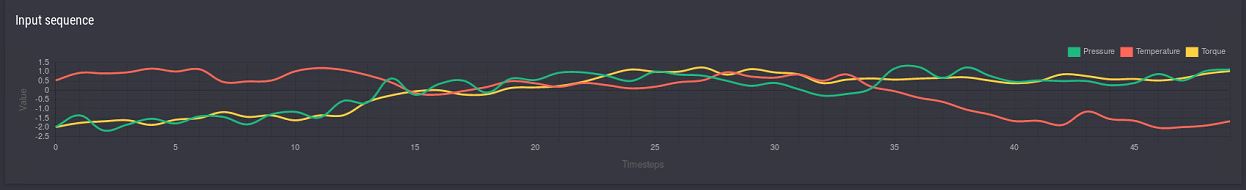
Which patterns appear in the data and how does a sample looks like? - A simple visualization shows the data as a data stream and you can select the samples you are interested in.
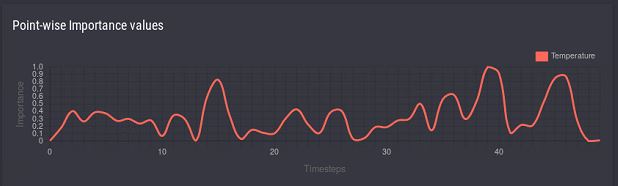
Input Importance
Does the network look at the important patterns? - A detailed visualization shows the data important for the decision to identifiy relevant patterns and information about the channel importance.
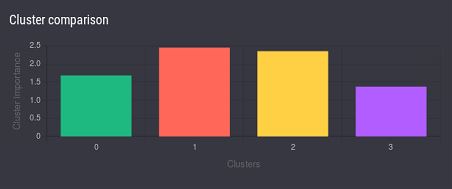
Network Clustering
Is there a redundancy in the network? – Multiple filters in the network might learn the same pattern. Filter clustering helps in identifying the similarity and variability in the learnt patterns.
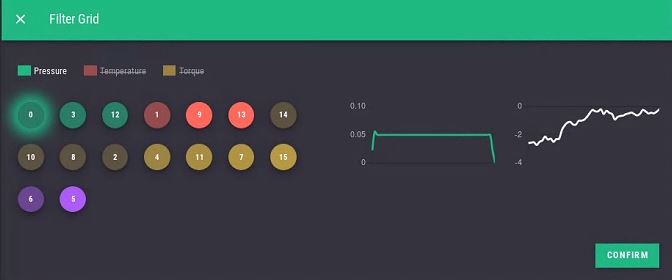
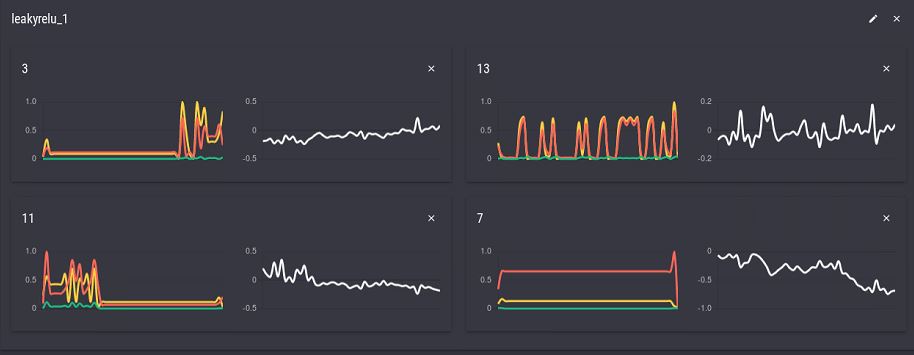
Filter Importance
Which filters are relevant for the decision? - Most times you want to know which part of the network was important for the descion. Sort the filters and select those you want to inspect or prune.
Filter Similarity
Unterstand the similarity of filters! - We provide a view that makes it possible to align filters of different layers and compare their input influence as well as their output to identify similarities.
Network Optimization
Understood the network? - A highlight of the framework is the interactive optimization. You can optimize the network based on the discovered insights and directly visualize the effects.
User Experience Level
Our dashboard can be divided vertically into three different levels. The first level fits stakeholders, data scientists, and other user groups that are only interested into the data rather than the internal network functions. The second level fits users that apply neural the network and have a coarse understanding of the inference process. The Thrid level fits experts that want detailed information to understand and optimize the network. These level are achieved with a clear rowwise seperation of the presented data.
- Input Data
- Prediction Confidence
- Input Point Importance
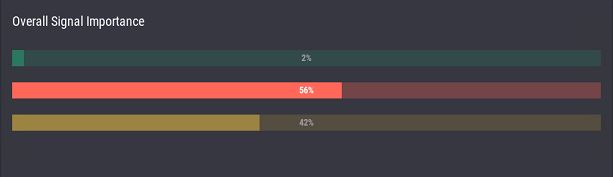
- Signal Importance
Level 1
No deep learning experience- Input Data
- Prediction Confidence
- Input Point Importance
- Signal Importance
- Network Structure
- Filter Importance
- Filter Clustering
Level 2
Superficial deep learning experience- Input Data
- Prediction Confidence
- Input Point Importance
- Signal Importance
- Network Structure
- Filter Importance
- Filter Clustering
- Filter Statistics
- Filter Point Importance
- Filter Channel Importance
- Filter Output
- Filter Comparison
- Network Optimization
Level 3
Detailed deep learning experienceOur Partners
This work was supported by the BMBF projects DeFuseNN (Grant 01IW17002) and the ExplAINN (BMBF Grant 01IS19074). We thank all members of the Deep Learning Competence Center at the DFKI for their comments and support.
TSViz - A Time Series Visualization Framework
Our framework offers a board varity of visualizations aligned with the user experience. User can look at the model from different perspectives and interpret the behavior. A detailed and interactive visualization is provided by the dashboard and can be used to interactively explore the network.


Our Team
TSViz was developed by a team of researchers at German Research Center for Artificial Intelligence GmbH (DFKI).


Try it out!
Get our code at Github and explore your data and network. Discover insights and optimize the process.
Contact Us
Feel free to contact us in case you have any question or problem related to our framework or service.
Address
Trippstadter Str. 12267663 Kaiserslautern
Deutschland
Phone Number
+49 631 20575 3521